
Have you already heard of Deleaker? If not, I would like to invite you to read this article.
Deleaker is a tool that will definitely help you uncover and fix memory leaks in your application. Check it out!
Last month, I received a message on LinkedIn from Artem Razin, author of Deleaker (and CEO at Softanics), asking me to test his tool for RAD Studio. Although I’m a Delphi developer, I’ve heard about Deleaker a few times from C# developers. So, when he mentioned that there was a version for RAD Studio, I thought: “Wait, what?!”. 😀
Deleaker is a developer tool that finds leaks in the code (memory leaks, handles, GDI, and others), but, differently from popular libraries, it brings some great extra features to enhance the fixing process. For example, it shows the processes linked to the application, modules and an impressive Resource Usage Graph to monitor the application’s performance.
The tool was initially developed for Visual Studio, back in 2006, and now has an extension for us, Delphi and C++ developers.
When Deleaker is installed, it adds a new menu to RAD Studio:
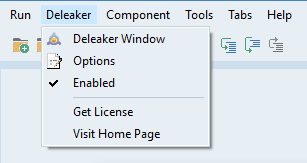
Through this menu, you can access Deleaker options and the main window:
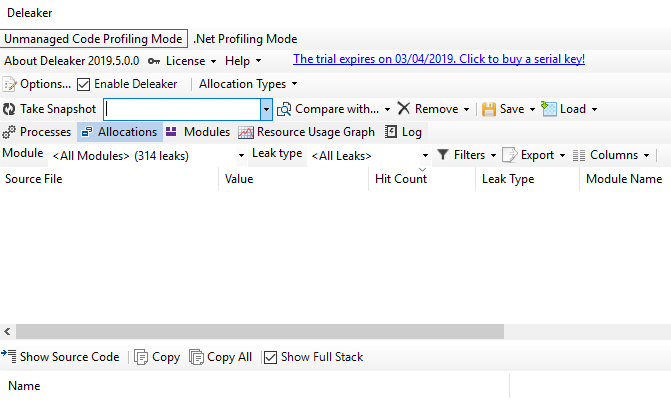
When enabled, Deleaker will automatically perform a full analysis when the application closes (process termination), by loading symbols, heap allocations and other procedures. Then, it will show all the leaks found, categorized by type and with their respective source code file:
By selecting the leak, we can view details, like the full call stack. And wait for it: italso shows the source code line which caused the leak! This is an amazing feature that helps (a lot!) to find the leaks immediately. Without this information, we’d have to search for the leak through the code with no guarantee of finding it in a short term.
I did a simple test: in a new project, I instantiated a global object in a button click event, but I didn’t free it anywhere purposely. When I closed the application, the Deleaker window popped up and displayed the memory leak with the exact line where it happened.
With this tool, you can also:
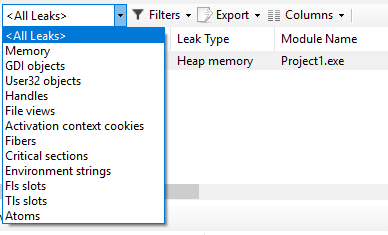
- Filter or hide specific leaks
- Export results to XML
- Save and load snapshots
- Compare different snapshots
- Customize analysis settings
If you’re interested in Deleaker, visit the official website:
I’d like to thank Artem for the opportunity of testing this tool. It’s simply fantastic!
By the way, Artem Razin is also the author of ArmDot and BoxedApp!
Bye!
Bom dia Andre, o Deleaker é gratuito e para todas as versões do Delphi? Tem videos explicando como usá-lo para achar os vazamentos? André, estes vazamentos de memória ocasionam Out of Memory e Access Violations?
Judeir, para usar o Deleaker é preciso adquirir uma licença, mas você pode testá-lo gratuitamente por 14 dias. Na página oficial também há um tutorial bem detalhado de como usá-lo.
Sobre a terceira pergunta: Sim! Os vazamentos de memória ocasionam Out of Memory (falta de memória) e Access Violations (violações de acesso). Por este motivo que a correção de leaks é muito importante em um projeto.
Abraço!
Quanto custa a licença do Deleaker?
Olá, Judeir.
O valor da licença do Deleaker está na página oficial:
https://www.deleaker.com/order.html
Abraço!
Conteúdo interessante, gostei.